.jpeg)
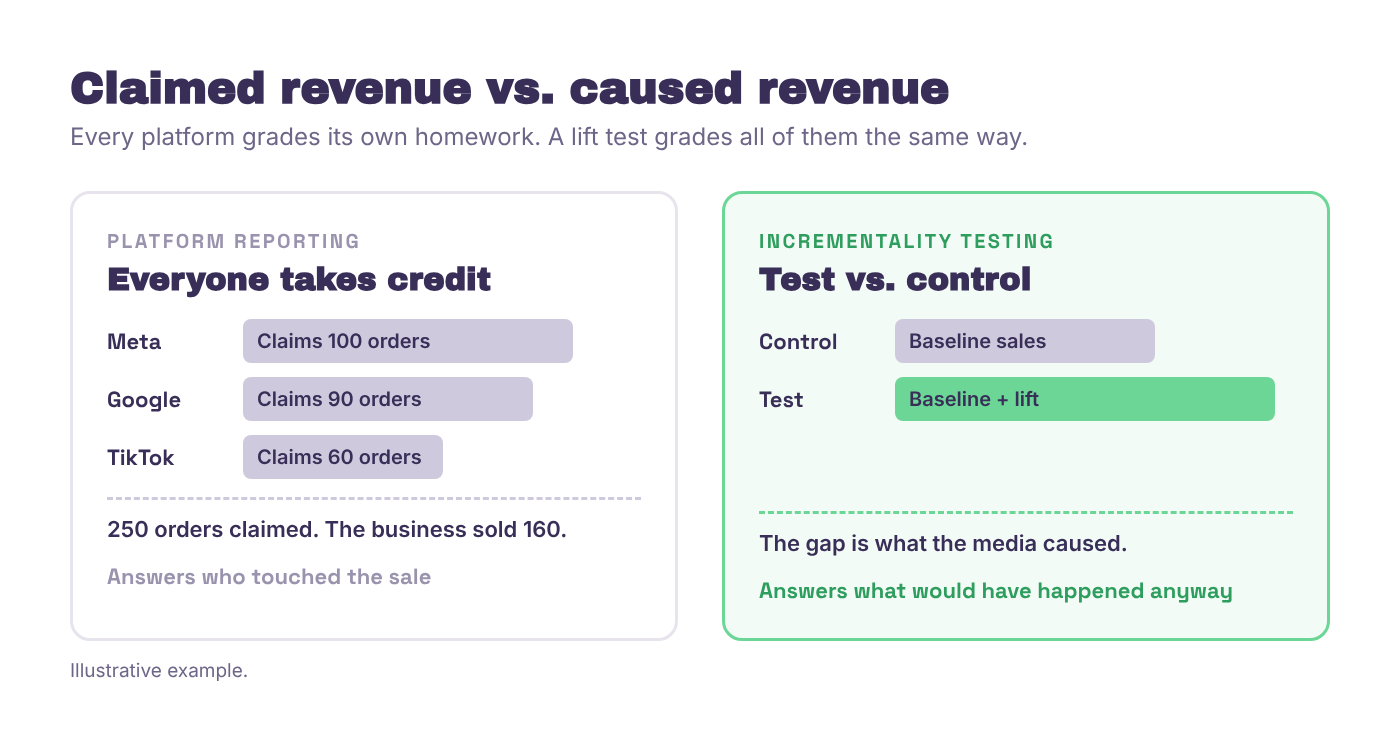
Most DTC brands do not have a reporting problem. They have a truth problem. When Meta, Google, TikTok, and your analytics platform all claim the same sale, in-platform ROAS stops being a decision tool and turns into a comfort metric.
Incrementality testing is the clearest way out. It answers the question every founder and growth leader eventually asks. What revenue happened because of our media, and what would have happened anyway?
There are plenty of good guides on how to run a geo-lift or a holdout test, and I will walk through the method below. But after years of sitting on the client side of these conversations, I have learned that the method is rarely where testing breaks down. It breaks down after the test, when the results are on the screen and someone has to decide what to do with them. So this playbook covers both halves. How to run the test, and how to make sure the answer actually changes something.
The short version. Incrementality testing measures the revenue your advertising caused, not the revenue platforms claim. It only pays off when the brand and the agency agree, before launch, on what a win, a loss and a flat result each mean for budget, and when the results are built into the reporting your team and your CFO already use.
Moving Beyond Last-Click
Incremental revenue is revenue that would not have happened without a specific marketing action. If a customer was going to buy anyway, a platform taking credit for that order does not mean the platform caused it.
Platform reporting is built to show platform value. Last-click attribution rewards the final touchpoint. Neither one separates correlation from causation. A branded search campaign can look incredibly efficient while the paid social campaign that created that demand looks expensive.
To find out which channels are actually driving incremental revenue, you need a baseline, meaning the sales your brand generates without the media you are testing. That baseline includes organic traffic, repeat customers, email, retail and marketplace sales, seasonality and the general momentum of the business. Blended reporting can show you where channels overlap. Controlled testing is what proves it.
How to Run an Incrementality Test
Define one clear hypothesis, isolate one major variable, and compare a test group against a valid control group over a fixed period. Measure the lift in total business outcomes, not just attributed conversions.
Step 1. Start with a business question, not a platform metric
A strong test begins with a decision you actually need to make.
- Should we increase TikTok spend?
- Is branded search defending demand, or harvesting demand paid social already created?
- Does Meta prospecting create net new customers at our current spend?
- Is our CTV or podcast investment creating blended revenue lift?
Then turn it into a hypothesis you can measure. For example, increasing TikTok spend by 20% will produce at least a 10% lift in total sales in the test markets.
Step 2. Agree on what you will do with every possible answer
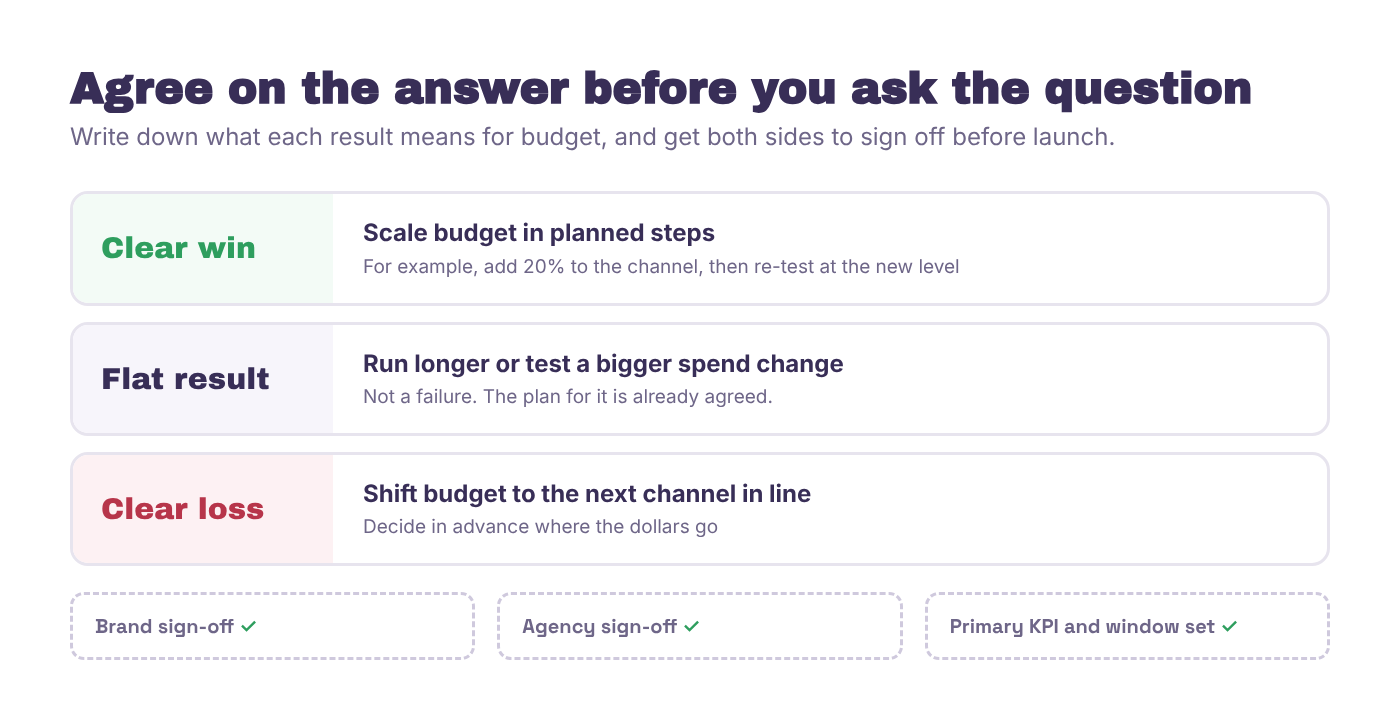
This is the step I would never skip, and it is the one most teams leave out. The thing I see most often is that the test goes great and then nothing changes, because nobody agreed on what we would do with the answer.
Before launch, the brand and the agency should agree in writing on what a win, a loss and a flat result each mean for budget. I always ask one question in that kickoff. If this comes back flat, what do we do? If we cannot answer that, we are not ready to launch.
Step 3. Choose the right test design for your scale
The right method depends on order volume, conversion density and how precisely you can isolate exposure.
- Geo-lift test. Best when you have broad regional spend and enough orders by market. Geography is easier to isolate than people.
- Audience holdout. Best when you have strong first-party data from Shopify, Klaviyo or your CRM.
- Meta Conversion Lift. Useful for a Meta-specific question, run inside Meta's own framework.
Step 4. Set the timeline and significance rules before launch
Set the testing window, minimum sample size, primary KPI and confidence threshold before day one. For most DTC brands the primary KPI should be total revenue, new customer revenue or orders at the market or audience level. Do not end a test early because early results look exciting or alarming.
Step 5. Protect the test from contamination
- Keep pricing and offers stable
- Avoid major landing page changes
- Hold creative steady unless creative is the variable
- Limit changes in overlapping channels
- Confirm tracking and market mapping before launch
Step 6. Measure lift, then translate it into economics
Compare the change in total business outcome in the test group against the control group. Convert that lift into incremental revenue, incremental orders, incremental CAC (iCAC), incremental ROAS (iROAS) and POAS after COGS and contribution margin. This is where incrementality becomes useful to the CFO, not just the media team.
What a Real Test Taught Us About Where Sales Land
Hypotheticals are helpful, but real results are what earn trust, so here is one from our own book of business, anonymized.
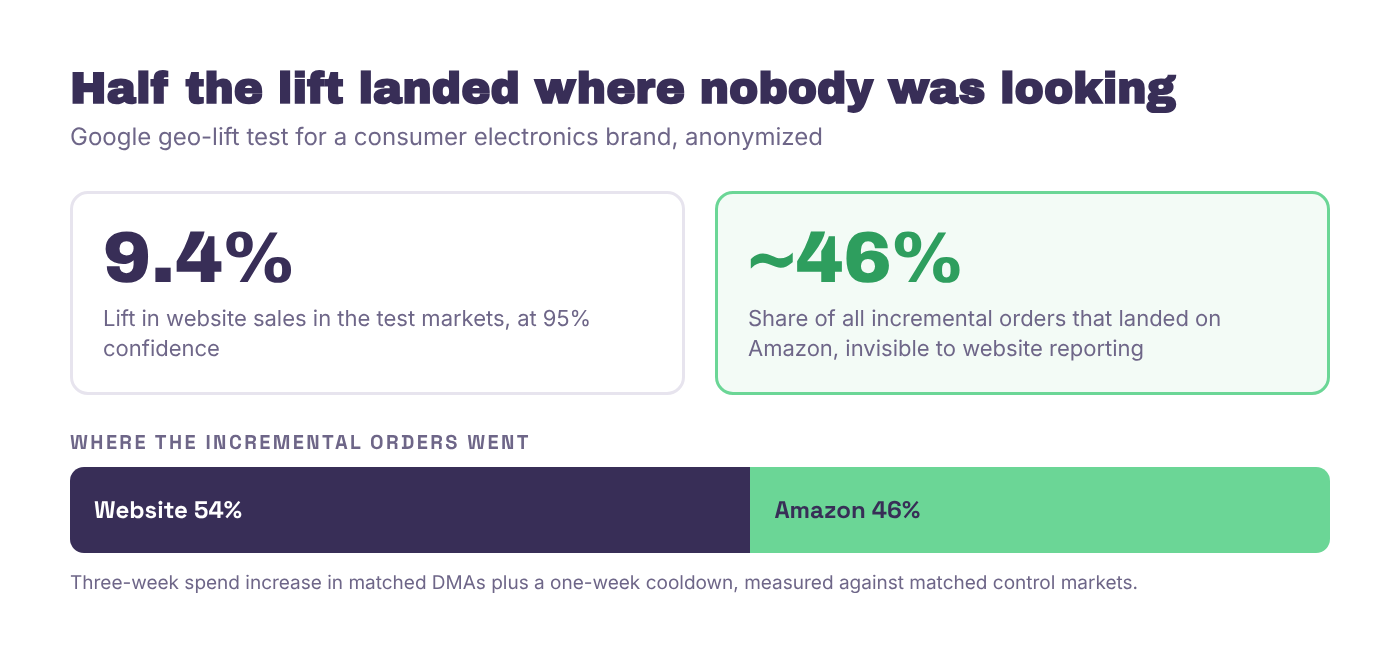
We recently wrapped two geo-lift tests for a consumer electronics brand that sells on its own site and on Amazon. The brand's reporting, like most, only gave media credit for orders on its website. We increased Google spend in a set of matched test markets for three weeks, followed by a one-week cooldown, and compared them against control markets where nothing changed. Website sales in the test markets rose 9.4% against control, at 95% confidence. That alone was a useful answer.
The bigger surprise was where the rest of the impact showed up. Close to half of all the incremental orders Google drove, about 46%, happened on Amazon. None of that showed up in the brand's website reporting, so Google was getting no credit for it. If we had judged the channel on site sales alone, we would have undervalued it and probably cut it.
The Meta test we ran alongside it is a good example of a less tidy answer. Website sales showed a clear 7.1% lift at 95% confidence, but the Amazon read only reached 80% confidence, which is not strong enough to act on. So we reported it exactly that way. Meta clearly drives the website, and the Amazon effect needs a longer or bigger test before anyone should budget around it. Because we had agreed on what a partial result meant before launch, that was a next step, not a disappointment.
What Is a Geo-Lift Test and How Does It Work?
A geo-lift test uses geographic regions as the test and control groups. You change media pressure in selected markets, keep matched markets stable, and measure the difference in total revenue or orders between them.
The quality of the read depends on market matching. Pair markets with similar historical revenue trends, conversion rates, average order value, repeat purchase rate, seasonality and pre-test media efficiency. If one market is heavily retail-driven and the other is mostly ecommerce, the comparison gets weaker fast.
You can either increase spend in the test markets to measure the lift from more media, or pull it back to measure what demand disappears. Either way, compare blended outcomes across every place the customer can buy, not just platform-reported conversions. As the example above shows, that includes marketplaces.
Holdout Testing and Meta Ghost Bidding
Holdout testing withholds ads from a randomized slice of your audience so that group can act as a baseline. To set one up, build a first-party audience from your CRM, Shopify or Klaviyo, split it randomly into test and holdout groups, sync only the test group to the ad platform, keep messaging and timing consistent, and measure purchases and revenue across both groups for the full window. It works especially well for retention, win-back and upper-funnel prospecting questions.
Meta's Conversion Lift uses a method often called ghost bidding. Meta estimates when it would have shown an ad to someone in the control group, without actually serving or charging for it, which reduces some of the bias in a standard holdout. It is helpful for a faster read inside Meta (see how Meta calculates conversion lift), but it measures Meta's impact under Meta's framework. It does not tell you about the rest of your mix or about margin. We treat it as one input, not the final verdict.
Reading the Results, Including the Flat Ones
Not every test gives a clean answer, and that is fine. A flat result is still a result. It only becomes a problem when the client did not know it could happen, or when nobody agreed on the next step. That is how brands lose faith in testing altogether, and it is avoidable.
Some of the most valuable things a lift test gives me and our strategy team are conversations, not numbers. When ROAS looks soft, especially after we have pulled spend back on purpose, a client's gut reaction is to cut. Real lift data lets us say "here is what the media actually did" instead of asking them to trust us. Over time, that builds a ton of trust, and it leads to better budget decisions on both sides.
Once the results are in, sort each channel by what the test showed.
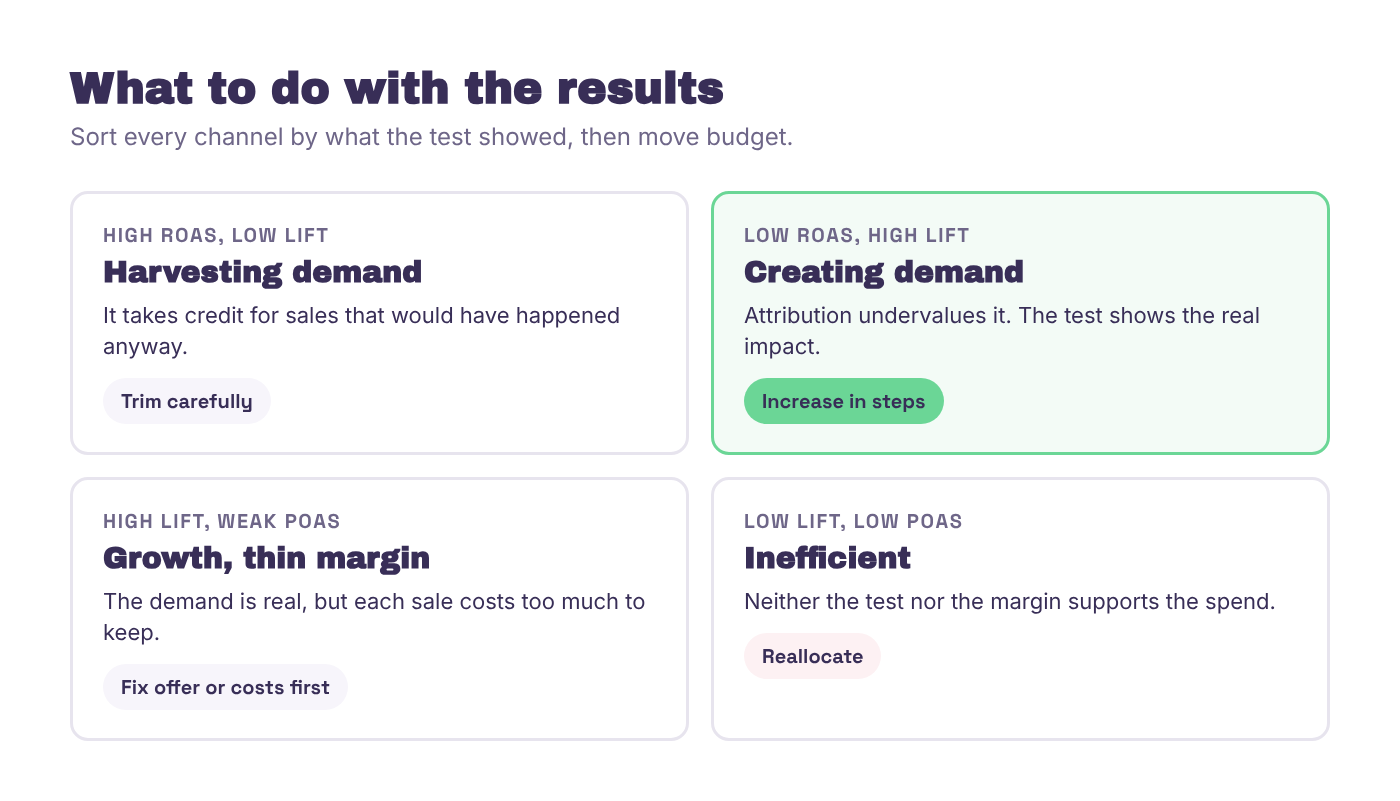
The pattern this uncovers most often is a gap between the dashboard and reality. Channels that look efficient in-platform are often harvesting demand created by channels that look inefficient.
Turning One-Off Tests Into an Always-On Measurement System
A single lift test answers one question at one point in time. The harder part is keeping that answer alive in the reporting people look at every day. This is where most teams slide back to platform dashboards and last click.
Part of the reason is that switching how a client measures success is a bigger deal than it sounds. When you move someone from GA4 or last-click to an incrementality-calibrated view, all the numbers they are used to shift. A channel that looked great can look average, and one they were ready to cut can suddenly look like the best investment in the plan. If you do not manage that change, people quietly go back to the old numbers.
When we make that switch with a client, three things happen together.
- Reset the goals. A ROAS target set on last-click numbers does not translate to an incremental view. Agree on new targets in the new currency.
- Show finance the bridge. Walk the CFO through how the old number connects to the new one, so the change reads as better information, not moved goalposts.
- Lead with a two-minute summary. Every report should open with a simple summary a CFO can read in two minutes. What we tested, what we learned, what we are changing.
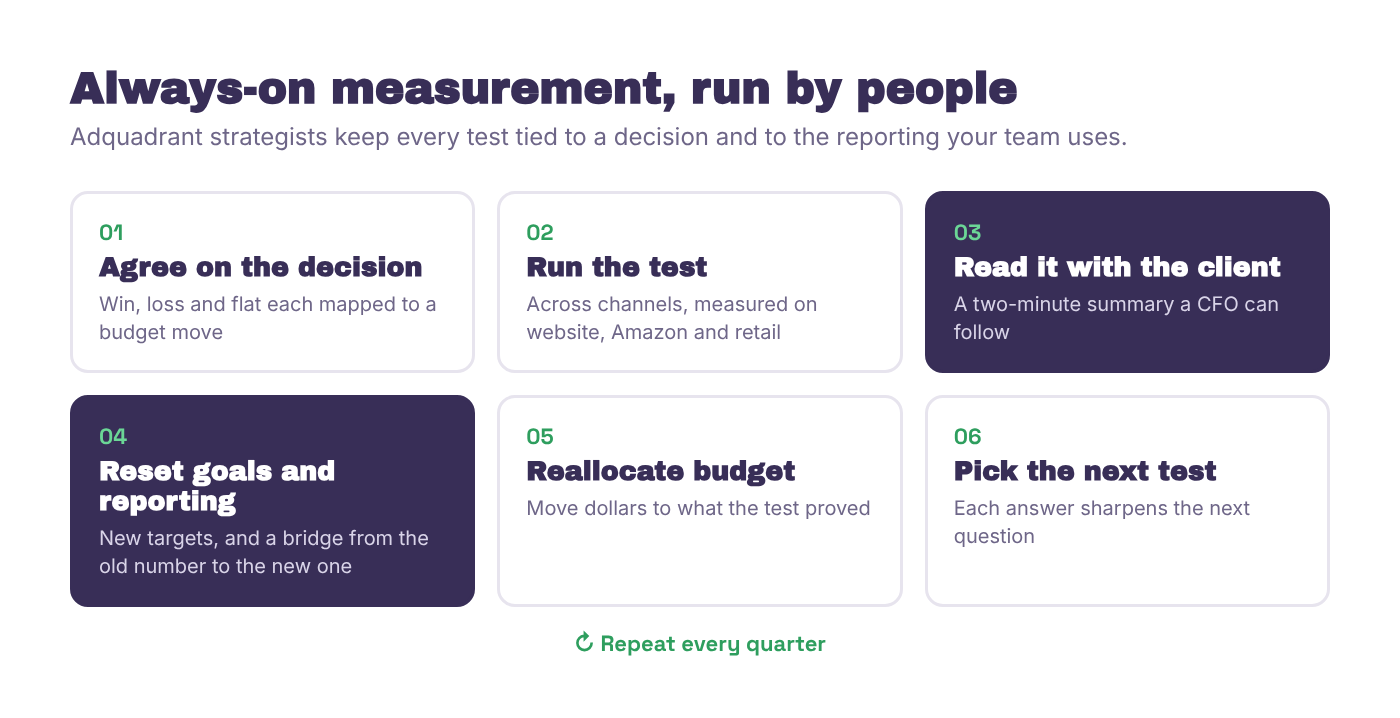
At Adquadrant, our strategists design each test around a budget decision you actually need to make, run it across your channel mix, and feed the results back into the attribution and budget models your team uses every day. We do this as a WorkMagic Official Agency Partner, which gives us independent measurement that reads results beyond your website, including Amazon and retail. The technology gives us the measurement. Our team turns it into the plan, and stays accountable for it.
What to Do Next
- Audit where attribution overlaps today. Pull a 30-day cross-channel report and flag every order more than one platform claims.
- Pick one budget decision that needs a clearer answer. Choose a channel you are thinking about scaling or cutting.
- Agree on win, loss and flat before launch. Write down what each result means for budget, and get both sides to sign off.
- Measure everywhere customers buy. Include Amazon and retail in the read, not just your website.
- Translate results into POAS, not just ROAS. Calculate iROAS, iCAC and contribution profit so the findings drive real budget decisions.
- Plan how the answer will live on. Decide how the result will reset goals and reporting before the readout, so it keeps paying off.
If you want to see what your channels are actually causing, and have a team that will help you act on the answer, book a measurement conversation with Adquadrant.
About the author
Katie comes to Adquadrant with a background in digital marketing, specializing in DTC and ecommerce brands. As an Account Director, she has partnered with brands across fashion, beauty, lifestyle, tech, and CPG, helping clients drive growth through strategic campaign planning, creative development, performance insights, and strong client partnerships. She earned her bachelor's from CU Boulder and her master's degree from the University of Denver. She is a mom of two kids (plus two dogs!) and a Colorado native who enjoys anything outdoors, spending time with her family, traveling, reading, and binge-watching Bravo.