How to Maximize Ecommerce Success Using TikTok Analytics
With 102 million users in the United States, TikTok’s unprecedented engagement potential offers ecommerce brands a new opportunity to connect with a vast and diverse audience. But effectively leveraging TikTok’s potential requires more than engaging videos; it demands the strategic use of TikTok Analytics.
TikTok Analytics provides a deep dive into critical metrics such as engagement rates, video views, follower growth, demographic information, and more. For DTC brands, these insights are invaluable. TikTok Analytics isn’t just about understanding data; it’s about transforming insights into action.
This article aims to demystify TikTok’s analytics platform and explain how to leverage its capabilities to understand who your audience is, what content resonates with them, and how to maximize visibility and engagement.
Deep Dive into TikTok Analytics Features
TikTok’s analytics suite is vast. Here are some key features of TikTok Analytics and how ecommerce brands can leverage analytics on TikTok to elevate their content strategies, boost engagement, and drive follower growth.
Dashboard Overview
The Dashboard Overview provides a holistic view of an account’s performance. It’s a snapshot offering a quick gauge of brand visibility and content reach.
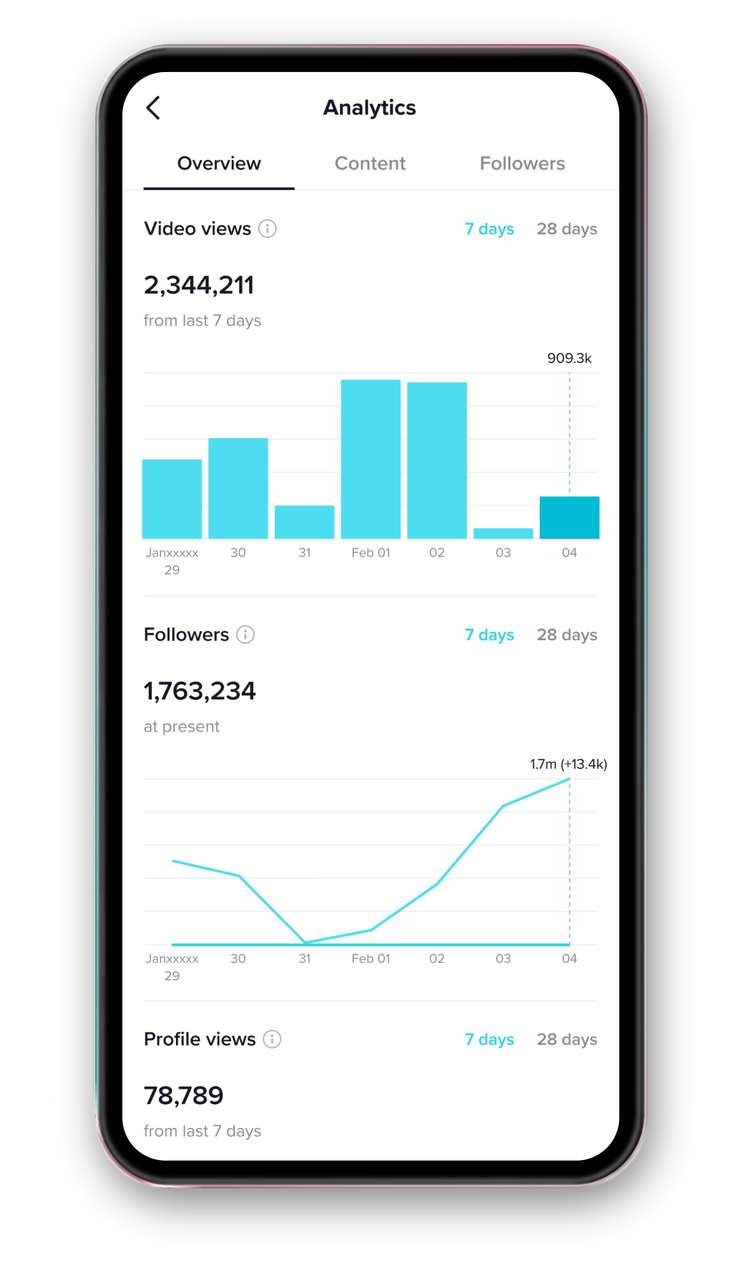
Here are a few of the key metrics you’ll find on the TikTok Analytics Dashboard Overview and how to leverage them to boost conversions:
Video Views
The total number of daily views across all of your videos.
A steady increase in daily video views suggests growing interest and engagement with your brand. Conversely, a decline could indicate waning interest and the need to refresh your content.
High total daily video views relative to your follower count indicates strong engagement. Capitalizing on this momentum with calls to action and encouraging follows can convert casual viewers into loyal followers.
Follower Count
The growth or decline in your TikTok community.
Follower count is crucial for understanding brand loyalty and how effectively you’re retaining your audience. Monitor your follower count closely.
If you notice stagnation or decline, consider launching targeted follower growth campaigns like collaborations with creators, participation in trending challenges, or giveaways that encourage users to follow your account for a chance to win.
These at-a-glance metrics offer a quick view of the health of your TikTok account. However, don’t just look at the raw numbers; look at the engagement trends over time. If a particular type of content leads to higher profile views but not necessarily a significant increase in follower count, it might indicate interest without conversion. This scenario calls for tweaking your call-to-action (CTA) strategy within videos to convert interest into follows and, ultimately, purchases in your store.
Profile Views
The number of times your TikTok profile has been viewed over a specified period.
Unlike other metrics that might reflect passing engagement, an increase in profile views indicates user interest beyond a single video, which means a deeper interest in your brand and its offerings.
A high number of profile views relative to your follower count suggests your content is intriguing to non-followers. To keep their attention, ensure your profile is optimized with a clear and compelling bio, easy navigation to your ecommerce store, and a cohesive, appealing grid of video content that represents your brand’s identity.
Conversely, a low number of profile views compared to your follower count could indicate that your current followers are not regularly engaged or motivated to check your profile for new updates. To get your followers back on your profile, launch initiatives like teaser videos that direct viewers to your profile for the full content, exclusive offers, or information about new products. This not only increases profile views but also enhances engagement with your brand’s entire content ecosystem.
Content Insights
Content Insights goes deeper, offering detailed metrics for individual posts. Ecommerce brands can analyze top-performing posts to identify patterns in content, themes, or posting times and repeat those elements in future campaigns. They can also identify and exclude the elements that don’t resonate in lower-performing posts. Let’s explore some of the metrics available in TikTok Analytics content Insights and how ecommerce brands can leverage them to boost their online store’s success.
Likes, Comments, and Shares
These engagement metrics are fundamental indicators of how compelling your audience finds your content. High engagement rates suggest that content resonates well with viewers, prompting interaction and sharing.
You can use these metrics as benchmarks for A/B testing different content formats, captions, hashtags, or posting times and refine your content to address the needs, preferences, and questions of your audience. For instance, if certain videos attract a lot of questions about product usage, subsequent content can focus on tutorials or FAQs.
When you identify themes that consistently spark engagement, encourage user-generated content (UGC) around these themes. If a video of a customer using your product in an innovative way gets a lot of engagement, create a hashtag challenge inviting others to share their unique uses of your product.
Total Play Time
How much of your video content is actually being watched. Videos with high total play times indicate strong viewer interest and content relevance.
Use total play time to determine the optimal length of your videos.
If shorter videos tend to hold viewers’ attention better, lean into shorter-form content. But if you notice that your audience is willing to watch longer videos, it may indicate their willingness to engage with more in-depth content.
Follower Insights
Understanding your audience is crucial. Follower Insights provides a comprehensive look at your followers’ demographic and behavioral data. For DTC brands, these insights are instrumental in tailoring content and marketing strategies to the audience’s preferences and behaviors. Here are some specific strategies that ecommerce brands can employ to leverage these analytics effectively:
Gender Breakdown
A percentage split of your audience by gender.
Use this metric to customize marketing messages. For example, if 90% of your audience is female, speak to them directly by starting your videos with lines like “Hey Ladies!” or “Girls, you’ll never believe this.”
Or you may find that you have a relatively even split of male and female viewers. Through analysis and testing, you may find that content featuring men resonates well with men but not women. However, you may also discover that content featuring women resonates equally well with both genders. Use these insights to strategically adjust your content to reach and expand your target audience.
Top Territories
The geographic distribution of your followers, highlighting where they are located.
With the data on top territories, design localized marketing campaigns that cater to the cultural preferences and buying behaviors of those regions.
For example, if you notice that a large or growing audience segment is based in Japan, leverage this insight by creating a series of TikTok videos featuring popular Japanese creators, making content entirely in Japanese, and offering discounts during Golden Week (a popular Japanese holiday period).
Activity Times
When your followers are most active on TikTok, helping to pinpoint the best times for posting content.
Look for patterns in engagement related to when content is posted. Schedule your most engaging content types during these peak times to ensure maximum visibility and engagement.
Understanding when your followers are most active can also inform the timing of live streams, Q&A sessions, or interactive posts. Schedule these community engagement initiatives during peak activity times to maximize participation and interaction.
LIVE Video Analytics
LIVE Video Analytics offers a window into the performance of live broadcasts. Metrics specific to live broadcasts can inform brands about the content that captures and retains viewer attention, enabling them to refine their live content strategy. Here’s how ecommerce brands can harness specific insights from live video performances:
Viewer Count
Indicates the number of viewers at different points during the live stream. Peaks and troughs in viewer count can highlight the most and least engaging segments.
Examining the viewer count over various live sessions can help you determine the times when your audience is most likely to tune in.
Schedule streams to showcase new products or services during peak times, leveraging high viewer count segments to introduce these offerings. This strategy can create buzz and direct immediate traffic to your ecommerce site, capitalizing on the live engagement.
Engagement
Interactions such as comments, likes, and shares during the live broadcast.
High engagement rates signal strong viewer interest and participation. Engagement metrics can guide the development of more interactive content, not only increasing engagement but also providing valuable insights into customer preferences and concerns.
For example, if viewer questions or polls increase engagement, incorporate more of these interactive elements in your live streams.
During live sessions with high engagement, offer exclusive discounts or promotions for your ecommerce store. This tactic can convert live engagement into immediate sales, leveraging the real-time interaction to encourage viewers to take action.
After a live session, repurpose high-engagement segments into short-form TikTok videos, maximizing the content’s reach and driving traffic long after the live stream has ended.
LIVE Gifts
LIVE Gifts lets you collect Diamonds from your viewers, a direct measure of the value they place on the content. Diamonds are a type of reward on TikTok that you can receive as a Gift from your viewers that can be converted into money or other virtual items.
Receiving Gifts is a powerful indicator of the content’s monetary value to your audience. If certain types of live content consistently generate more gifts, consider focusing on similar content themes.
Analytics-Driven Creator Partnerships
One of the most effective strategies for connecting with your target audience and driving ecommerce success is leveraging creator partnerships on TikTok. The insights offered by TikTok Analytics can help you find creators whose followers mirror your brand’s target demographic and make affiliate partnerships with them.
By analyzing these demographic details of a creator’s audience, including age, gender, geographic location, and interests, brands can strategically create affiliate partnerships with creators whose followers are most likely to be interested in their products.
Moreover, analyzing affiliate performance through engagement rates, video views, and follower growth provides a clear picture of a given their ability to captivate and influence an audience — or not.
For instance, if a particular affiliate’s content drives a significant increase in traffic to your ecommerce store but fails to convert this traffic into sales, there may be a mismatch between the content and your product offering or a need to refine your landing page for better conversion optimization.
Sharing analytics insights with your partners can foster more productive collaborations. Creators get a chance to understand what content is most likely to drive conversions and how they can better align their content with your brand’s objectives. This collaborative approach, grounded in data, can enhance the authenticity and effectiveness of affiliate content.
Overcoming TikTok Analytics Challenges
TikTok Analytics offers a wealth of information, but the sheer volume of data can sometimes be overwhelming. Moreover, because of the rapid pace at which social media trends evolve –especially on TikTok– brands have to remain agile, constantly adapting their strategies based on the latest analytics insights. Here, we explore how DTC brands can overcome these challenges and avoid common pitfalls while using TikTok analytics.
Interpreting Analytics Data Effectively
One of the key challenges brands face is distinguishing between surface-level metrics and actionable insights. For example, high video views or follower counts are encouraging, but they don’t necessarily translate into ecommerce success.
Effective data interpretation demands focusing on metrics that directly impact your business goals, such as engagement rates that lead to conversions or follower growth in your target demographic. It also means understanding the context behind the numbers—why a particular video performed well, what it says about your audience’s preferences, and how you can replicate that success.
Avoiding Common Pitfalls:
- Over-reliance on Single Metrics: Don’t base strategic decisions on a single data point. Look at a comprehensive set of metrics to get a fuller picture of your performance.
- Ignoring Context: Trends, seasonal variations, and other external factors can all influence your analytics. Consider these elements to understand the real story behind the data.
- Failure to Segment Data: Analyze your data based on different audience segments, content types, and campaigns for nuanced insights that inform more targeted strategies.
Embracing a data-driven approach doesn’t mean being ruled by numbers. It means using the right numbers as a guide to better understand and engage with your audience. Embracing this comprehensive, data-driven guide to TikTok Analytics enables DTC brands to not just navigate but thrive in this fast-paced digital marketplace, turning insights into action and data into dollars.
About the Author: Pamela Covert is a Senior Client Partner at adQuadrant with 5+ years of digital marketing and technology experience. She graduated from Louisiana State University in 2018 with a BS in Marketing and a concentration in Professional Sales. From there, she’s partnered with industry leaders like Ford Automotive, Camp Bow Wow, FastSigns, and TELETIES to build and grow their paid advertising strategies. She currently resides in Texas and, outside of work, enjoys trying new restaurants, college football (Geaux Tigers!) and her blue heeler, Levi.